How effective has your loyalty scheme been this month? Have you experienced an increase in covers as a result of a new promotional offer launched? Discover a wealth of customer-focused insights just like this and more, with our customer engagement reporting software.
Our Insights product pillar also contains operational performance reporting and labour analysis.
Customer Engagement Reporting
Monitor loyalty scheme performance
You’re utilising the Kobas customer loyalty app to reward your loyal visitors and drive further revenue, what next? Use our customer engagement reports to track how your loyalty scheme is growing, how active loyalty members are and how much they spend per head on average vs non loyalty members.
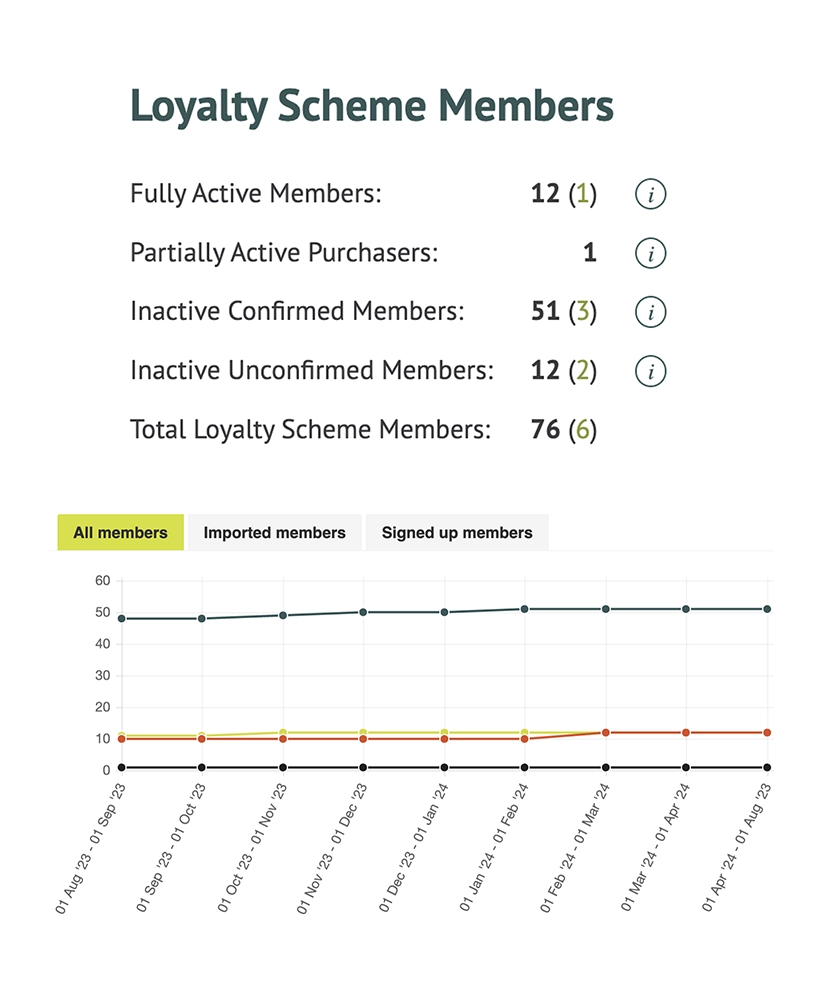


• Discover the quantity of member sign ups, whether that’s active members, partially active, inactive but confirmed, or inactive and unconfirmed.
• Analyse gross revenue from loyalty members vs non-members.
• View information across all purchases that have a loyalty customer associated to them, including the revenue they’ve generated and average transaction value.
Promotions and discounts performance
Running promotions and discounts is a tried and tested way to drive footfall and increase sales, and ultimately introduce your business to new customers. However, it’s also important to know exactly how the promotions and discounts in place are performing, including the impact on your bottom-line profit margins.
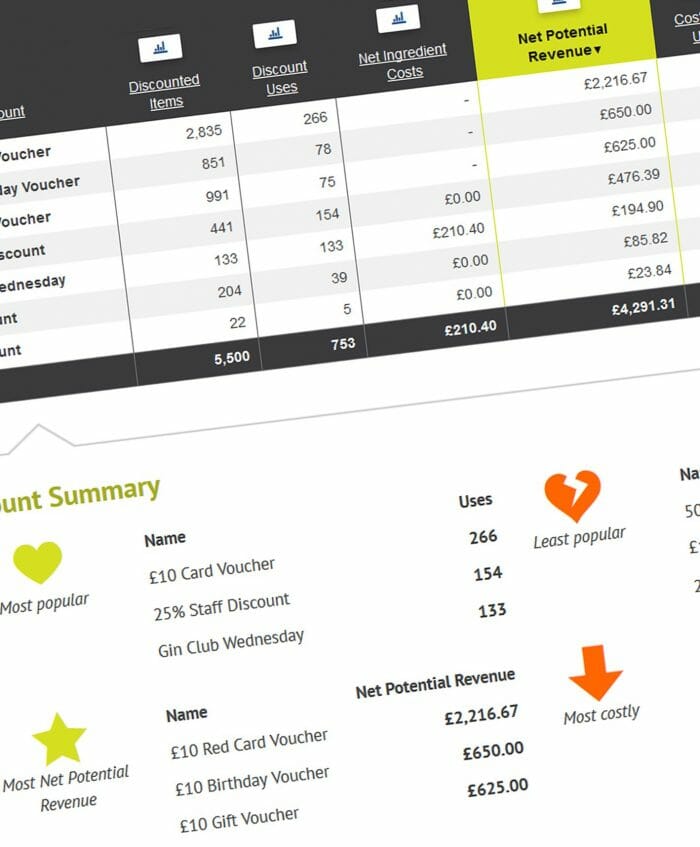
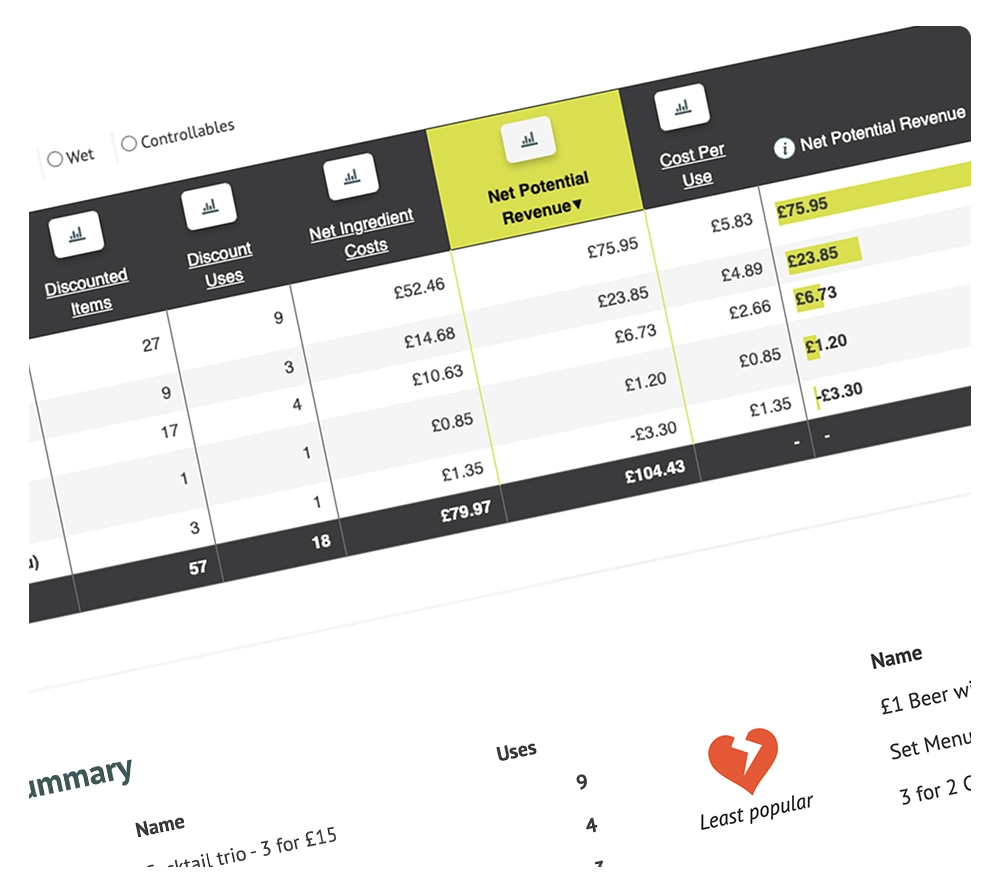
• Have you experienced an increase in covers since launching a certain promotional offer? Explore all sales activity surrounding your discounts and promotional offers.
• View comparative data between the ingredient costs and reduced sales revenue of discounted items.
• Analyse how many times a discount has been used within any date range and across selected sites.
• Discover the potential revenue lost due to the reduced sales prices.
Reservation analysis
By using our EPoS and reservation integration, Kobas can provide users with insightful data across all reservation activity. Analyse the status of your bookings and associated guests, payments added to reservations, lead times and more.
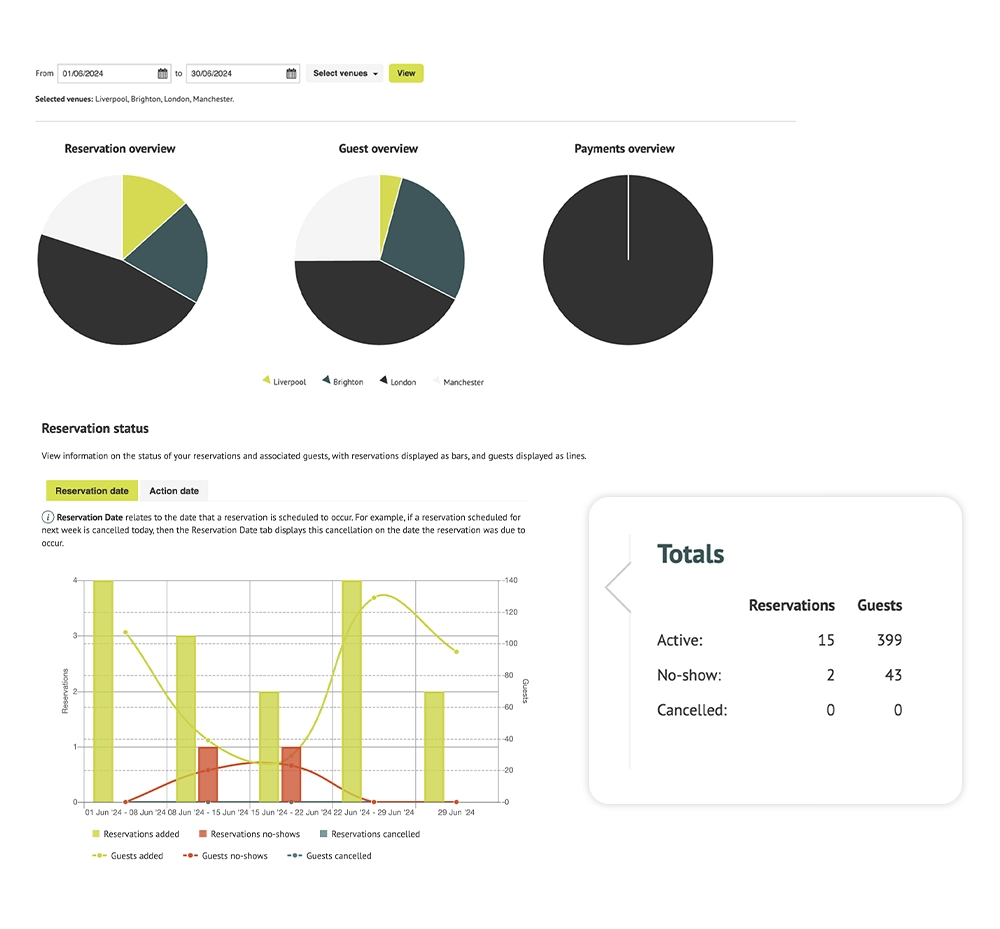
• Using date range filters, teams can understand reservation totals across those who showed up, those who didn’t and those who cancelled. With this information to hand, you might discover a high percentage of guests are not showing up. To combat that, you could make the decision to secure bookings with a deposit.
• Analyse deposits paid vs refunds.
• View the different types of bookings that your business is taking using customisable tags such as corporate or personal. These tags can be customised to suit your specific venue requirements and you can add as many as required.
• Do customers that have reserved a table spend more per head than those who haven’t booked? View key sales and reservation information just like this.
